
It’s time for another Traktip!
Issuetrak 10.2 introduced a new design to the Dashboard!
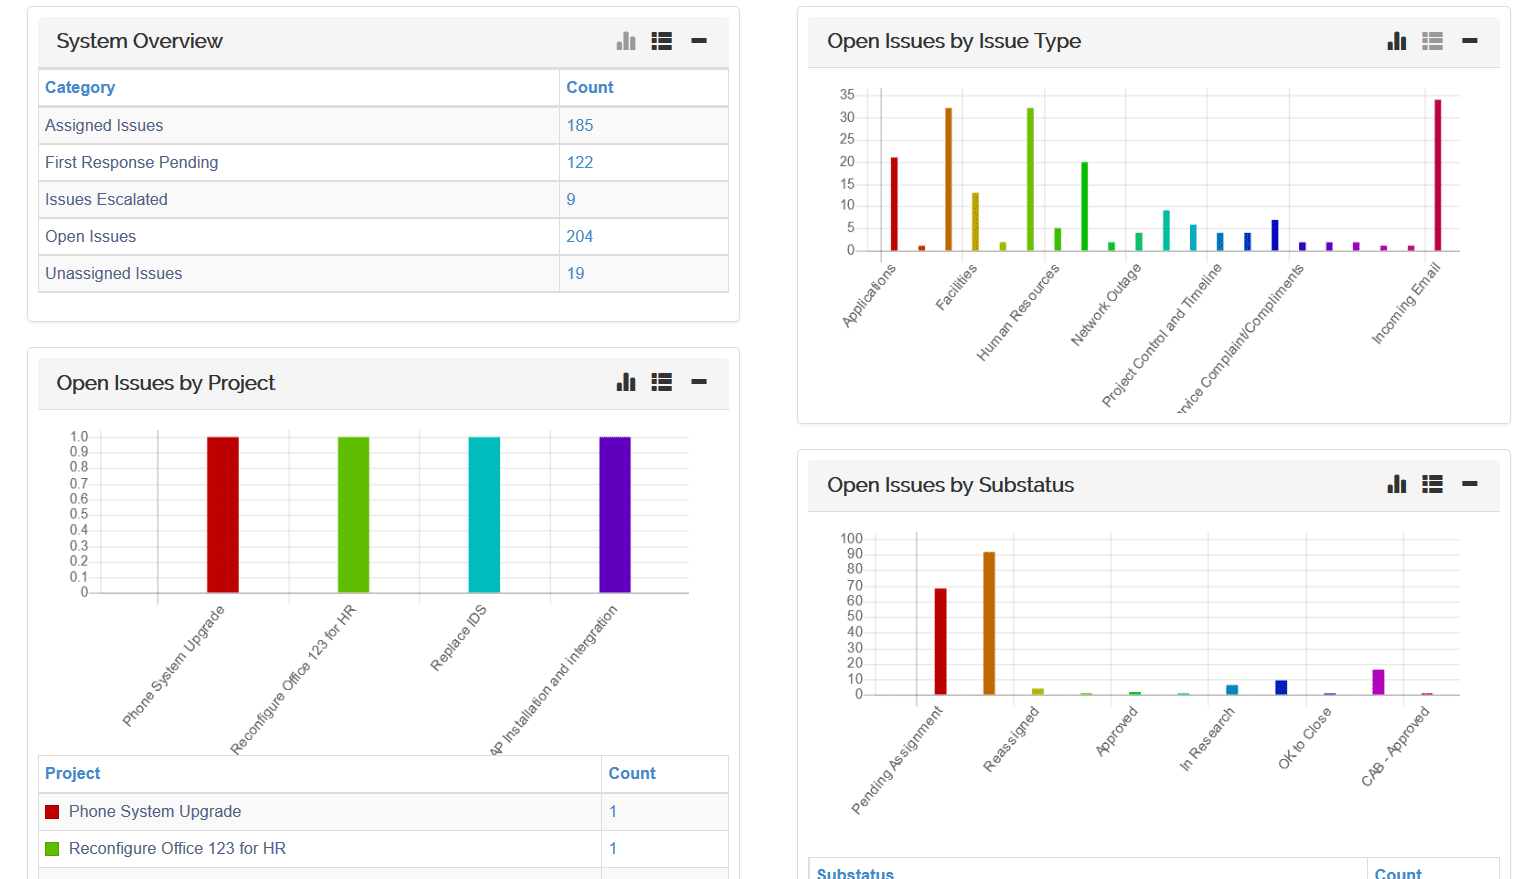
The Dashboard gives you a snapshot of your open issues, sliced and diced by various criteria, such as type, department, priority, assignment, project, and more. The new design allows you to display the chart, the list of issues, or both for each panel you include on your Dashboard.
The Dashboard is visible by any user that has the user or group permission “Dashboard” in the Menu Options/Pages Allowed section. Once a user has been granted permission to view the Dashboard, they need to set it up to view the panels important to them.
Setting up the Dashboard
The Dashboard will be blank the first time you view it. Each user can pick and choose from a predetermined set of panels to make sure all relevant information is front and center. Once the initial panel selection is completed, clicking on the Dashboard page will display the selected panels.
To set up your dashboard, follow these steps:
- Navigate to Home > My Issuetrak > Dashboard Settings.
- Select a panel from the top center drop down list.
- Click the button to add the panel to either the left column or right column.
- Choose whether to start the panel expanded to show all data.
- Choose whether the panel will display only the Data Table, only the Chart, or both the Table and Chart from the “Data Display Preference” drop down.
- Use the up/down arrows to move the panel up or down in the column.
- Click Save.
There are some panels, such as “Monthly Performance,” that only have a data table available. For these, the display preference will be grayed out.
You can adjust the panels displayed on your Dashboard at any time simply by repeating these steps.
As always, if you have any questions or would like to see this in action via a quick demo, we're happy to help!


Topics from this blog: Updates
Back